An AMD Helios AI training facility, modelled as a Cyber Digital Twin
The first in a series of open reference models: a navigable 3D model of a Tier III AI training campus, compiled by Eigenia from publicly available AMD and industry information.
- Facility
- Tier III, 96 Helios racks, two cells
- Fleet
- MI455X and MI355X
- Standards
- IEC 62443, CLC/TS 50701
- Principle
- Fail Fast, Fail Safe
An open-source research model
This model is built entirely from open-source, publicly available information. The workbook behind it, a bill of materials, an interface control document and factory acceptance tests, was compiled by Eigenia from publicly available AMD and industry information. The collected data was processed and cross-checked to raise confidence, and a Cyber Digital Twin was derived from it.
It is an open-source research model, not a model of any specific hyperscale installation, operator, vendor's equipment or configuration. Its purpose is to understand cyber risk and consequence from the physics of the facility, its design, the equipment installed in it, and how failures cascade towards worst-case scenarios.
This is the first in a series of open reference models. Further models are planned for drones, space systems, breweries, manufacturing facilities and robots.
Eigenia is not affiliated with, sponsored by or endorsed by AMD.
AMD, AMD Instinct, EPYC, Pensando and Helios are trademarks of Advanced Micro Devices, Inc. Dell, Arista and Broadcom names are trademarks of their respective owners.
What the reference model is
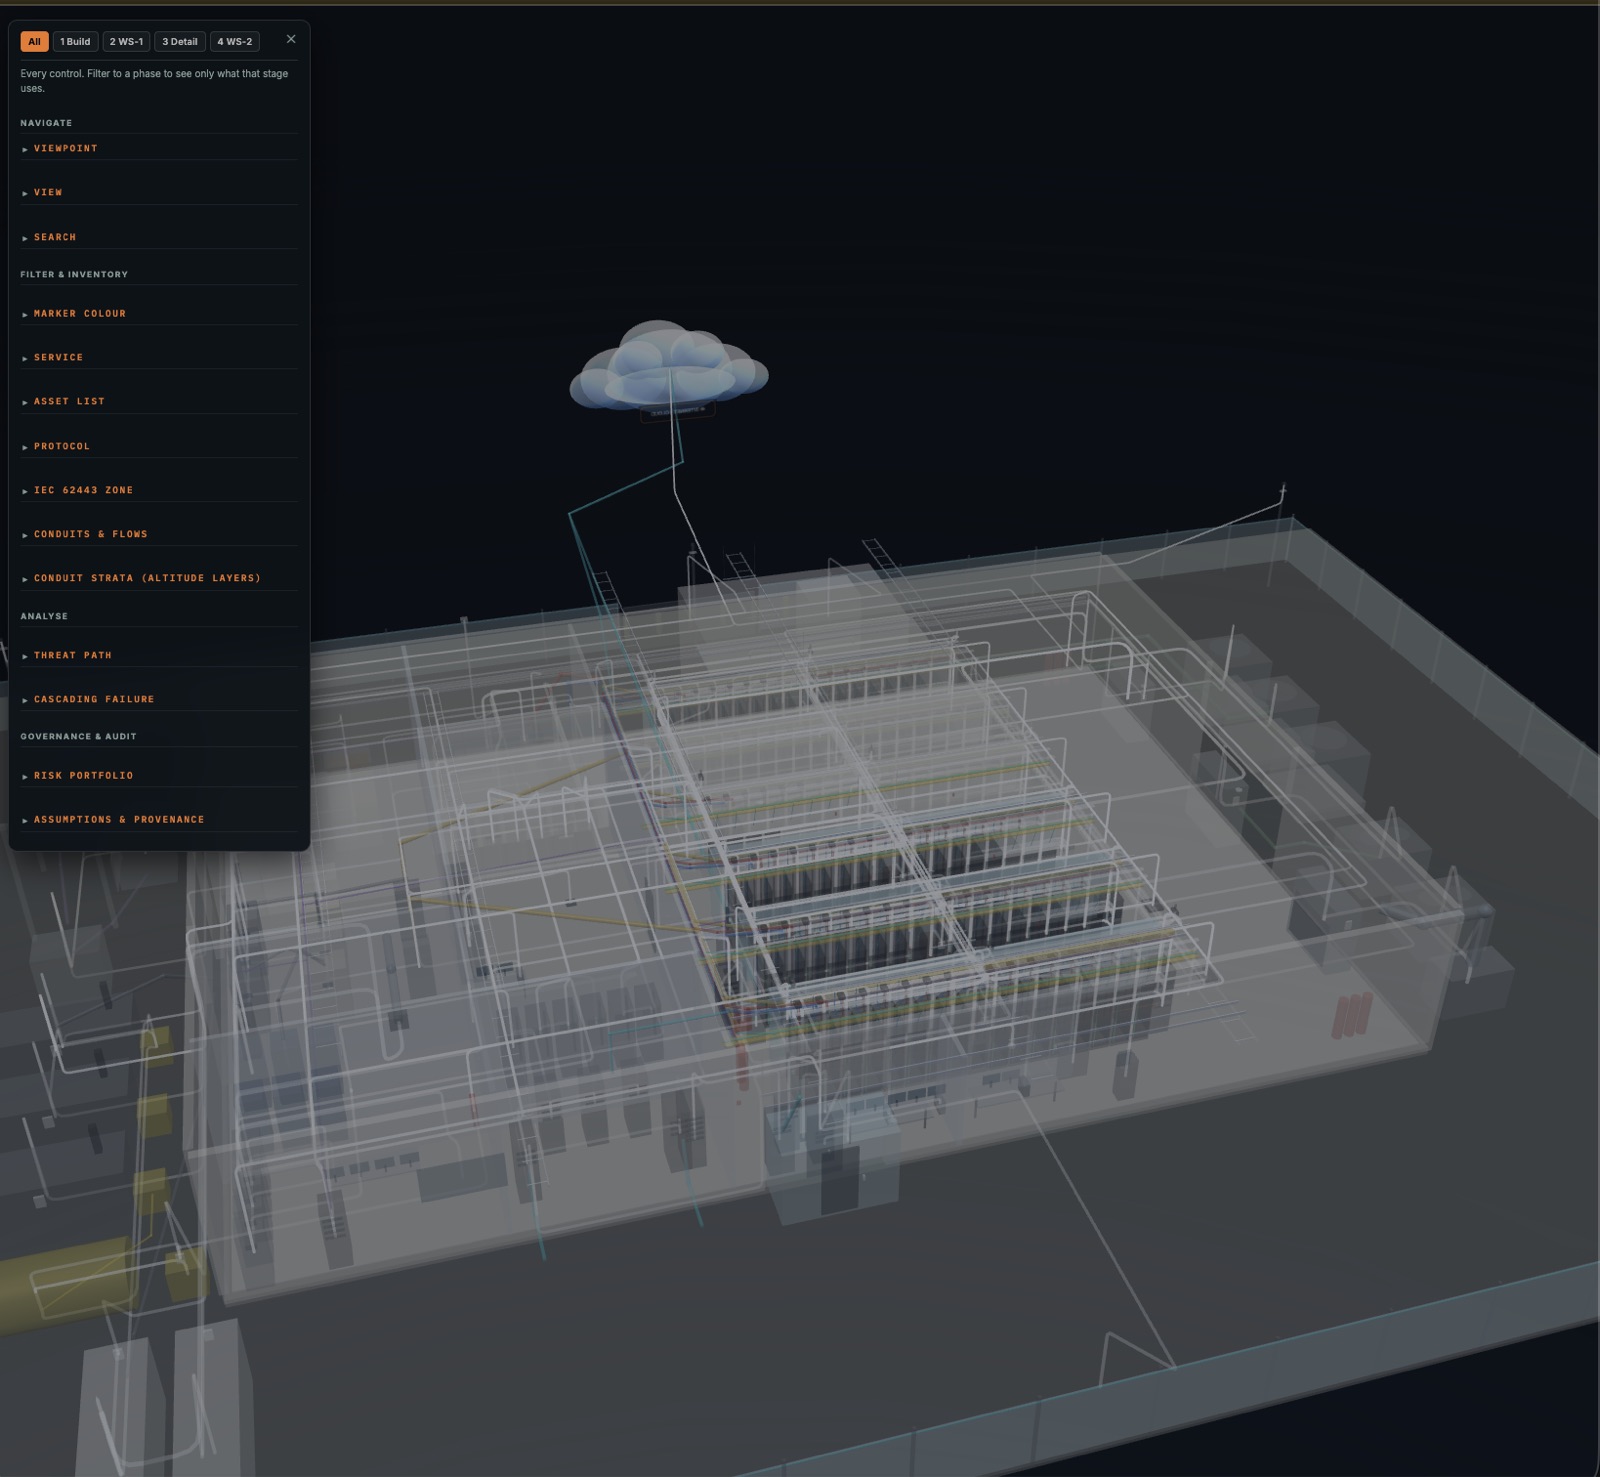
An AI training facility built on AMD Instinct accelerators, modelled as a Cyber Digital Twin: a navigable 3D model in which every component is a record, every connection is typed and routed, and every security and consequence finding is a query against the same dataset. This page describes what was built, how, and what a model of this kind gives the teams who run a facility.
The model was built with the Eigenia onboarding method from the workbook Eigenia compiled from public sources. All 28 interface rows in that workbook are represented in the model, and the build surfaced four places where an interface had been applied to the wrong accelerator generation.
A Tier III AI training campus
A Tier III, concurrently maintainable AI training campus: 96 AMD Helios double-wide racks with 72 MI455X accelerators per rack, organised as two independent cells. Each cell carries its own MV/LV distribution path, coolant distribution, BMS zone controller, fire detection and suppression, and OT network segment. Generation, bulk fuel, the central chiller plant and battery storage are shared by design.
The data hall runs a mixed accelerator fleet, which is common in practice and rarely modelled. Row 01 is the current generation; Row 02 is the previous one. The two have different memory, fabric, host link and cooling interfaces, and the model keeps them distinct rather than averaging them.
| Row 01 | Row 02 | |
|---|---|---|
| Accelerator | AMD Instinct MI455X | AMD Instinct MI355X |
| Architecture | CDNA 5 | CDNA 4 |
| Memory | HBM4, 12 × 36 GB on CoWoS-L | HBM3E, 8 × 36 GB |
| Scale-up fabric | UALoE (Ultra Accelerator Link over Ethernet) | Infinity Fabric xGMI |
| Host link | PCIe 6.0 | PCIe 5.0 |
| Platform | AMD Helios double-wide ORW rack | Dell PowerEdge XE9785L 3U DLC |
| Host CPU | AMD EPYC 9965, 192 cores | AMD EPYC 9005 series |
| Networking | Pensando Pollara 400, Salina 400 DPU, Vulcano 800 | Pensando Pollara 400, Salina 400 DPU |
How the model is built
The model follows the four-stage Eigenia onboarding method. This reference model shows what the method produces; the table describes how each stage runs when the method is applied to a real facility, where every stage ends in something the facility owner can hold and the two workshops are where the people who operate the facility correct the model.
| Stage | What happens | Output |
|---|---|---|
| 1Build model | Assets and connections extracted from the high-level and detailed designs (HLD, DLD) and the BOM, ICD and FAT workbooks; each link typed by service and protocol; physical routes solved through real containment | Asset register, connection register, routed 3D model |
| 2WS-1 Initial risk assessment | The model is reviewed with the facility's operators; observations and walk-throughs correct it to the as-is state; the threat is framed by sector, equipment class and geography | Zones, conduits, SL-T per zone, SIL-rated items marked |
| 3Detail risk assessment | FMEA, hazard log and minimum operating requirements attached to assets; failures propagated over real dependencies | Cascade scenarios, threat pathways, ALE per scenario |
| 4WS-2 Risk alignment | Pathways and consequence reviewed with the owner; gaps tested against ALARP and SFAIRP to agree a reasonable SL-C | ZCR diagram, SL-C, NOW / NEXT / NEVER, roadmap |
The unified dataset across disciplines is a primary deliverable. The P&ID, the TOGAF view, the Purdue Model, the network diagram and the 3D scene are different views of the same model, each serving a different perspective.
Asset classes, services and protocols
Asset classes
| System | Assets | Covers |
|---|---|---|
| IT | 138 | Accelerators, EPYC hosts, baseboards, memory, NVMe, storage, the AI software stack |
| DATA | 122 | Spine, ToR leaves, DPUs and NICs, transceivers, DMZ, enterprise and external pathways |
| PWR | 101 | Substation, MV/LV switchgear, transformers, UPS in 2N, generators, BESS, busways, rack power shelves |
| BMS | 68 | Head-ends, zone controllers, DDCs, DCIM, lighting gateway, protective instruments |
| SEC | 49 | Perimeter detection, access control, cameras, mantrap, dock and staging controls |
| FA | 40 | Fire panels, aspirating detection, clean-agent release, abort stations, PA/VA |
| CHW | 38 | Chillers, pumps, CDUs, quick-disconnect manifolds, cold plates |
| OT | 22 | Shared L2 switch, per-cell OT switches and firewalls, data diode, protocol gateway |
| AIR | 8 | CRAH units, room cooling, battery-room exhaust |
Connections by service
| Service | Connections |
|---|---|
| Data (IT) | 483 |
| Control (OT) | 283 |
| Water | 232 |
| Electricity | 208 |
| Air | 102 |
| Physical security | 68 |
| Fire and life safety | 47 |
| Condenser and fuel | 9 |
Protocols
More than twenty protocols are modelled and each is classed as routable or non-routable, because that distinction decides whether an attacker can traverse a link. The largest groups are physical flows (597), Ethernet/TCP-IP (430), RS-232 console (96), dry contact (59), Modbus TCP (45), 4-20 mA (34), BACnet/IP (29), Modbus RTU (29) and BACnet MS/TP (26). Memory and fabric links (HBM4, HBM3E, DDR5, CXL 2.0, xGMI) carry their own protocol rather than a generic PCIe label, so they can be filtered and reasoned about separately.
Every interface, traced to the model
The interface control workbook that Eigenia compiled from publicly available AMD and industry information defines 28 interfaces. Every one is cited by at least one connection or asset in the model, so each interface can be traced to the components it joins and the physical route it takes.
- ICD-0012 refs
- ICD-0023 refs
- ICD-0034 refs
- ICD-0044 refs
- ICD-0052 refs
- ICD-0062 refs
- ICD-0071 ref
- ICD-0081 ref
- ICD-0093 refs
- ICD-0102 refs
- ICD-0113 refs
- ICD-0121 ref
- ICD-0131 ref
- ICD-0141 ref
- ICD-0154 refs
- ICD-0162 refs
- ICD-0172 refs
- ICD-0184 refs
- ICD-0193 refs
- ICD-0201 ref
- ICD-0213 refs
- ICD-0222 refs
- ICD-0232 refs
- ICD-0241 ref
- ICD-0251 ref
- ICD-0267 refs
- ICD-0276 refs
- ICD-0281 ref
What modelling found that reading did not
Binding the interfaces to specific components exposed four places where an interface had been applied to the wrong accelerator generation. Each was corrected in the model and recorded with its source.
| Finding | Correction |
|---|---|
| ICD-002 had been applied to the EPYC host to MI455X link. The workbook names MI350X/MI355X as consumers only. | The MI455X host link is modelled as PCIe 6.0 with no ICD citation, because the workbook has no row for it. |
| ICD-003/004 had been applied to MI455X seating. Neither row names MI455X; MI455X uses UALoE. | MI455X scale-up stays on ICD-005 (UALoE). The seating edge carries PCIe 6.0 without a citation. |
| Memory and fabric interfaces were labelled "PCIe 5.0". | HBM4, HBM3E, DDR5, CXL 2.0 and xGMI became their own protocols. |
| The MI455X record was thinner than the MI355X record. | TDP is stated as the workbook's known data gap ("TBC, not officially confirmed as of Aug 2026") rather than omitted. |
Why this matters
The AI Rack Envelope
The AI Rack Envelope treats the whole GPU rack as one unit: frame, 48 V busbar, power shelf, rack PDU, quick-disconnect coolant manifold, cold plate set, ToR leaf, BMC aggregation, local NVMe, the accelerators and their scale-up fabric. It is not a separate system. It is the blast-radius unit for a busway, coolant or ToR loss, and the level at which procurement, acceptance testing and security requirements meet.
Each envelope asset carries its bill-of-materials line and its factory acceptance tests, so any component can be traced from the 3D model back to its BOM line and the test that accepted it.
| Asset | Product | BOM | FAT |
|---|---|---|---|
| Accelerator, Row 01 | AMD Instinct MI455X | BOM-G005 | FAT-GPU-003, FAT-GPU-005 |
| Accelerator, Row 02 | AMD Instinct MI355X | BOM-G004 | FAT-GPU-003, -004, FAT-COOL-002 |
| Host CPU | AMD EPYC 9965, Turin Zen 5c | BOM-C001 | FAT-MEM-001, FAT-MEM-002 |
| Baseboard | AMD OCP UBB 2.0 | BOM-G007 | None |
| DPU | AMD Pensando Salina 400 | BOM-N001 | FAT-NET-001 |
| RDMA NIC | AMD Pensando Pollara 400 | BOM-N002 | FAT-NET-002 |
| AI NIC | AMD Pensando Vulcano 800 | BOM-N003 | FAT-NET-004 |
| System memory | DDR5-6400 RDIMM, 12 ch/socket | BOM-C003 | FAT-MEM-001 |
| Scale-up switch | Broadcom Ethernet (UALoE) | None | FAT-GPU-005 |
| Rack power shelf and rPDU | Per rack, both rows | None | FAT-PWR-003 |
| Coolant manifold and cold plates | Per rack, both rows | None | FAT-COOL-001, FAT-COOL-002 |
| ToR leaf | Arista 7800R3-36P class | None | FAT-NET-002 |
| Software stack | ROCm 7.14, Kubernetes GPU Operator | None | FAT-SW-001, FAT-SW-002 |
37 envelope assets carry BOM or FAT references. The legacy generations recorded in the workbook (MI300X, MI325X, MI350X, MI300A) are kept with their BOM lines so the fleet view is complete. When the two rows were split, six generic per-rack assets were replaced by generation-specific components rather than duplicated; the duplicate-mesh integrity check is what caught the attempted duplication.
Zones, conduits and security requirements
Assets are organised into seven IEC 62443 zones. A conduit is a communication channel between zones, so every zone crossing is derived from the zones of its two endpoints rather than written by hand.
| Zone | Purpose | Assets | SL-T |
|---|---|---|---|
| Z0 | Enterprise IT, Purdue L4 to L5 | 233 | SL-T 2 |
| Z1 | DCIM and industrial DMZ, L3 | 34 | SL-T 2-3 |
| Z2 | Supervisory control, L2 | 80 | SL-T 2-3 |
| Z3 | Field devices and basic control, L0 to L1 | 195 | SL-T 1-2 |
| Z4 | Safety instrumented systems | 20 | SL-T 2-3 |
| Z5 | Out-of-band management and jump hosts | 19 | SL-T 3 |
| Z6 | Untrusted and uncontrolled: SaaS/B2B, tenant access, vendor remote access, vendor telemetry, the internet | 5 | No SL-T assertable |
Z6 is the zone most assessments leave out. It holds equipment and pathways the operator neither owns nor administers but which still terminate on facility systems. A security requirement cannot be levied on equipment you do not control, so Z6 carries no SL-T and every Z6 boundary is treated as hostile ingress.
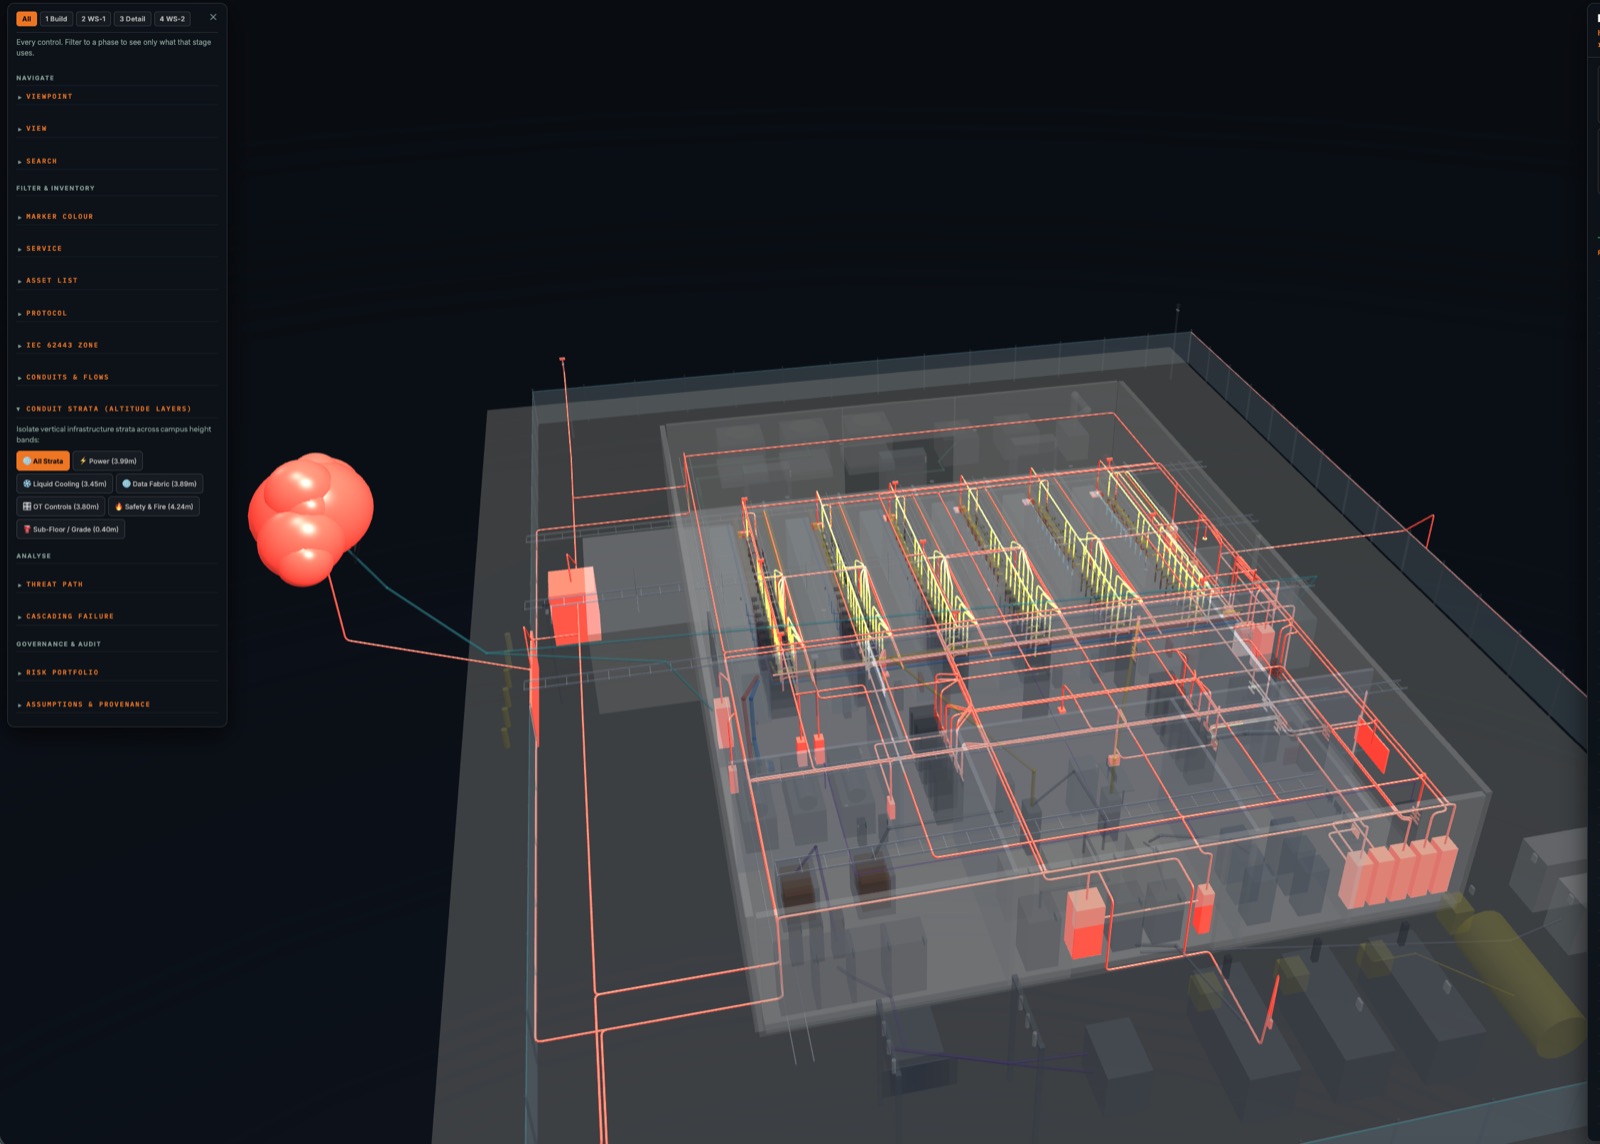
Critical intra-zone links are reported separately because they are consequential but are not conduits. Counting them as conduits would inflate the conduit figure.
| Crossing | Links |
|---|---|
| Z3 → Z0 | 224 |
| Z5 → Z0 | 201 |
| Z2 → Z0 | 105 |
| Z0 → Z3 | 102 |
| Z3 → Z2 | 94 |
| Z2 → Z3 | 45 |
| Z1 → Z2 | 26 |
| Z0 → Z1 | 16 |
The Z5 to Z0 crossing is dominated by 96 RS-232 console links from the out-of-band management estate. They carry no routable path, so no network-based threat walk will find them, and they are a large surface that deserves direct review.
Risk and consequence
The risk layer holds 38 hazards. Each names the assets it touches, carries severity, occurrence and detection scores, and has at least one costed safeguard. Consequence is valued on the accelerator estate and the training state it holds, using a modelled accelerator capital base of $504M ($5.25M per rack), rather than a generic facility revenue figure.
| Hazard | Deviation | RPN |
|---|---|---|
| N6-CY-003 | BMS reads an artificially low return temperature while the real supply temperature rises | 294 |
| N6-CY-004 | Compromise of the shared Purdue L2 switch reaches both electrical and cooling control | 288 |
| N7-CY-001 | Lighting gateway used to extinguish or dim emergency luminaires | 288 |
| N8-CY-001 | Unverified hardware enters the estate with a legitimate asset record | 288 |
| N11-CY-002 | Salina 400 DPU compromised: the control that enforces isolation becomes the attacker's | 288 |
| N2-CY-010 | Protection relay commanded to trip the MV breaker on demand | 280 |
| N2-CY-011 | UPS network management card used to force transfer, shutdown or bypass | 270 |
| N10-CY-001 | Vendor remote engineer endpoint used as the entry into the OT estate | 270 |
Model outputs from the research model, not a real operator's figures
Every monetary figure on this page, including the $504M accelerator base, is an output of the open research model, computed from its own assumptions. None is a real operator's cost, loss or budget.
Safeguards across all hazards total $1.38M in the model. Each is tied to the hazard it treats, so the case for any single control can be read from the pathway it closes and the consequence at the end of that pathway.
Inside the analysis
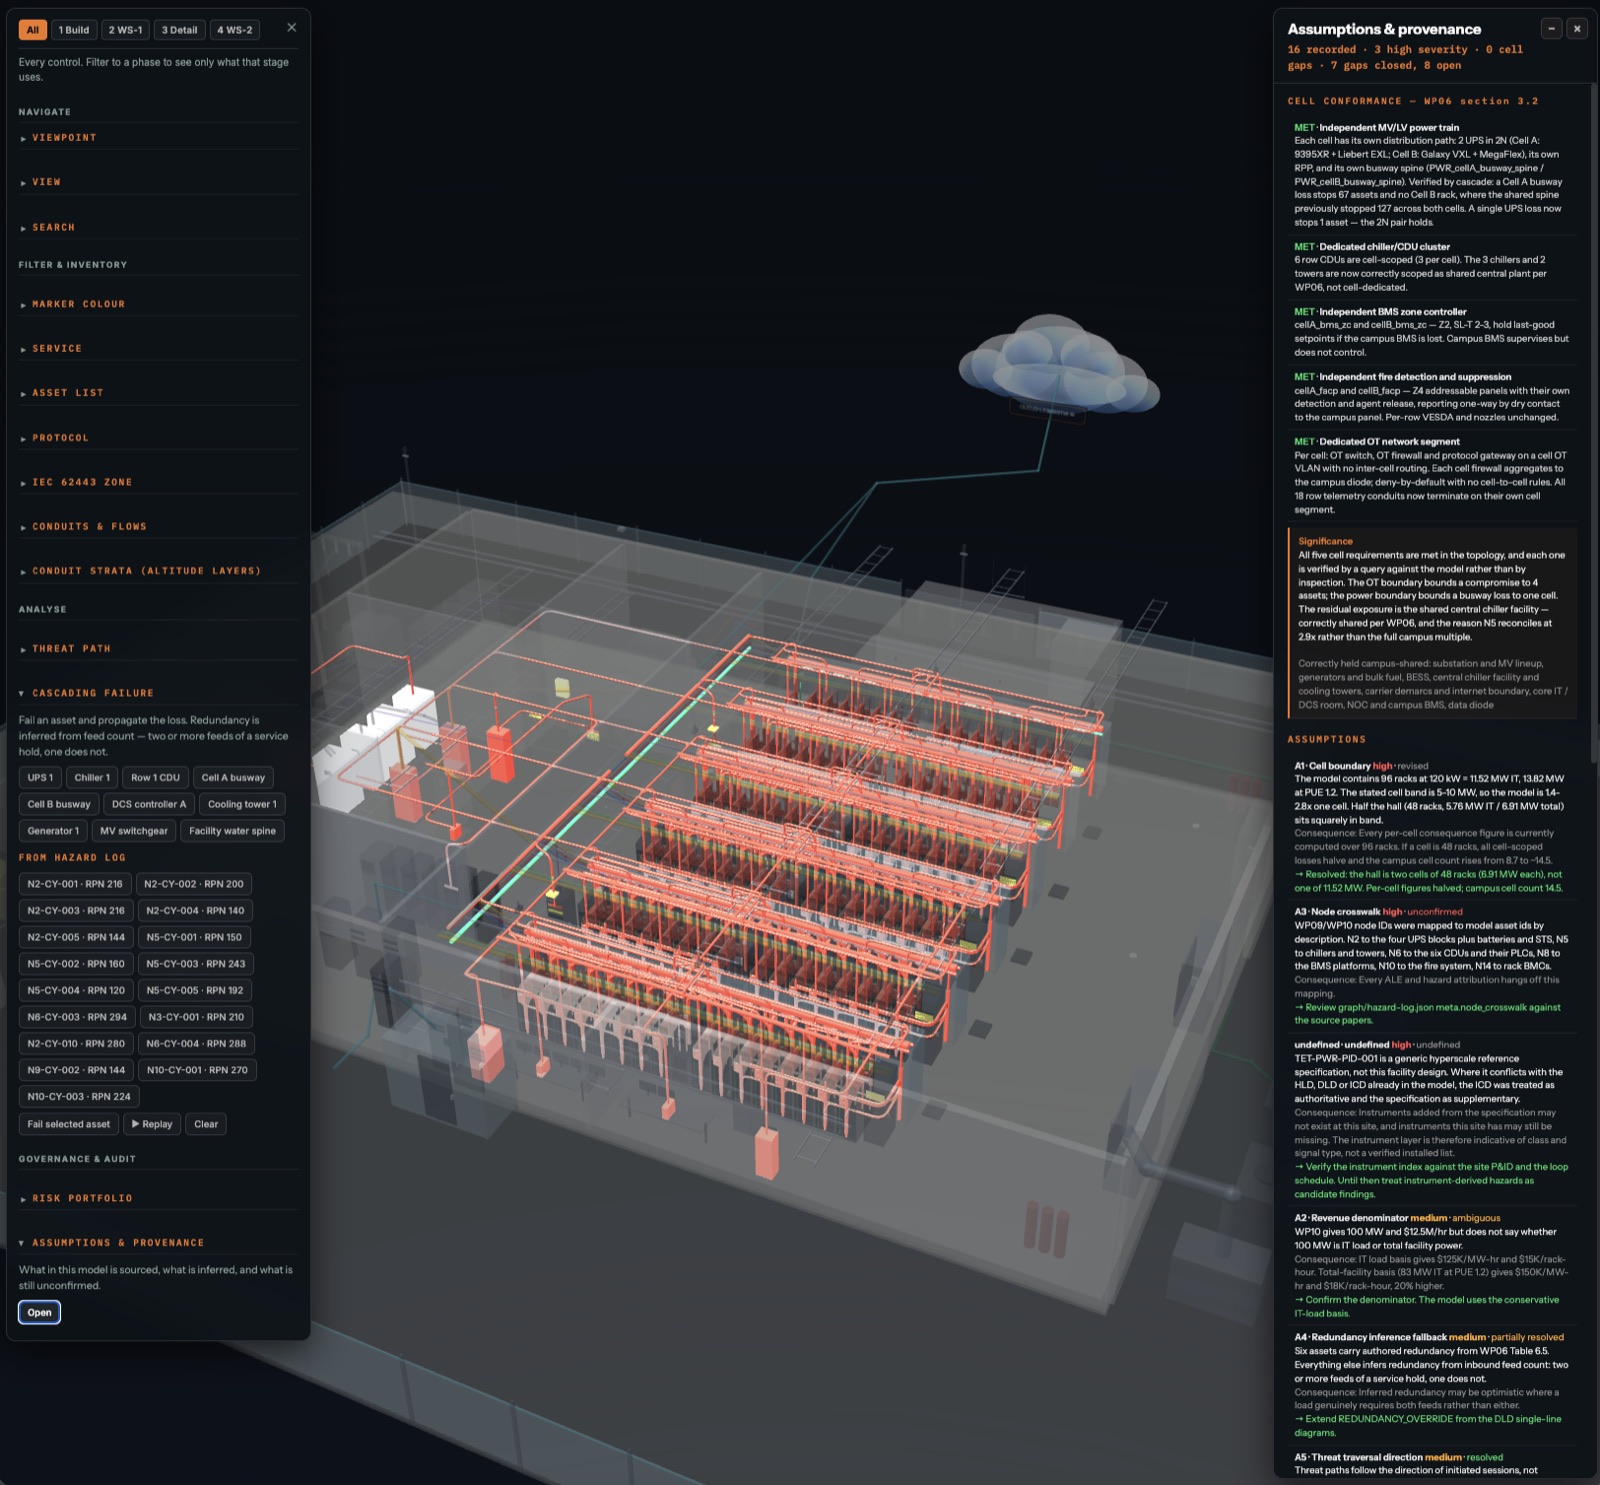
The asset register, routes and zones describe the facility. Four analyses turn that description into answers about risk. Each runs against the same dataset, so a result in one can be checked in the others, and every number below comes from running them on the model.
Threat path
Where can an attacker go?
From a chosen foothold, a walk over routable protocols only. Hardwired, analogue, serial and one-way links stop it, so the result is every reachable asset and every boundary that held.
Cascading failure
What stops when something fails?
Loss propagates wave by wave over power, cooling and control dependencies. Redundancy is honoured: two feeds of a service hold where one does not.
Hazard log
Which documented hazards matter?
Each of the 38 logged hazards can be launched as a scenario, so a line in the log becomes a visible chain of consequence rather than a score.
Risk portfolio
Which controls pay back?
Annual loss expectancy by node, with controls that can be applied to see residual exposure, spend and return on security investment.
Two failures, side by side
The clearest way to see what the analysis adds is to compare two scenarios. The first is a physical single point of failure. The second is a cyber attack taken directly from the hazard log, with a higher documented risk priority.
| A · Facility water spine lost | B · Chiller setpoint manipulated (N5-CY-002) | |
|---|---|---|
| Trigger | Loss of the facility water spine | Attacker raises chiller leaving-water setpoint from 7 °C to 20 °C (MITRE ATT&CK for ICS T0836, RPN 160, target SL-2) |
| Waves | 4 | 2 |
| Assets stopped | 117 | 8 |
| Degraded | 1 | 0 |
| Held by N+1 | 3 | 2 |
| Protection lost | 0 | 0 |
| Propagation by system | IT 96 · CHW 19 · AIR 1 · DATA 1 | CHW 7 · BMS 1 |
| Safety | HELD: no Z4 asset lost | HELD: no Z4 asset lost |
| Minimum operation | BREACH: 96 of 96 GPU racks stopped | HELD: no compute rack lost |
| Reliability | DEGRADED: 3 feeds now single-path | DEGRADED: 2 feeds now single-path |
| Protection | HELD: none lost | HELD: none lost |
| Authored loss (model) | N6 · ALE $820K/yr | N5 · ALE $575K/yr |
What the comparison shows
How a failure travels
Each cascade is recorded wave by wave, so the path from cause to consequence can be followed and challenged. The explorer counts the failed assets themselves as the first wave; the waves below are the propagation that follows.
A · Facility water spine lost
Wave 1 · Z2
IT room CRAC and all six row CDUs stop: cooling distribution is gone.
Wave 2
All 96 GPU racks stop, with the six row TCS supply headers and a virtualisation host.
Wave 3 · Z3
The six row TCS return headers stop. One asset is degraded: the BMS application server loses its data supply.
B · Chiller setpoint manipulated (N5-CY-002)
Wave 1 · Z3
The chilled-water buffer tank, cooling tower BAC 3000 and primary chilled-water pumps 1 and 2 stop, and propagation ends. The other four stopped assets are the chiller plant the attack targets.
Held by redundancy
The facility water spine holds, having lost 3 of its 9 water feeds.
Consequence of scenario A grows with duration. Computed in the model over the 96-rack hall at 11.52 MW and $15K per rack-hour:
Where the exposure sits
The risk portfolio aggregates authored loss by node. With no controls applied, baseline and residual exposure are equal at $11.93M a year in the model, spread over eight nodes. With all fourteen controls applied, the residual falls to $5.22M for $790K a year, a portfolio return of 750%.
| Node | System | ALE / yr, no controls | ALE / yr, all controls |
|---|---|---|---|
| N11 | AMD Helios accelerator estate | $6.56M | $2.62M |
| N10 | Z6 untrusted external pathways | $1.40M | $628K |
| N2 | UPS / power conversion | $1.24M | $744K |
| N6 | Shared L2 control network | $820K | $287K |
| N8 | Supply chain / receiving | $640K | $320K |
| N5 | Chiller plant / DLC coolant to cold plates | $575K | $316K |
| N9 | Fire suppression / clean agent | $410K | $184K |
| N1 | Generation / fuel | $295K | $118K |
Fourteen controls can be applied, each tied to the node it mitigates. Ranked by return on security investment:
| Control | Cost / yr | Mitigates | Nodes | ROSI |
|---|---|---|---|---|
| Independent mechanical fuel gauge logged per shift | $6K | 60% | N1 | 2,850% |
| Dual winding-temperature paths with discrepancy alarm | $24K | 40% | N2 | 1,970% |
| Operator-initiated, time-boxed, recorded vendor access (PAM) | $55K | 55% | N10 | 1,290% |
| UALoE single-trust-domain placement policy | $85K | 60% | N11 | 930% |
| Releasing panel on a dedicated NFPA 72 circuit, read-only status path | $22K | 55% | N9 | 930% |
| P4 pipeline signing + DPU management VLAN isolation | $64K | 55% | N11 | 810% |
| Continuous PFC / ECN telemetry with pause-frame rate limits | $38K | 35% | N11 | 640% |
| Immutable checkpoint snapshots on a separate credential domain | $72K | 45% | N11 | 590% |
| Tamper-evident receiving with attestation before staging | $48K | 50% | N8 | 570% |
| GPU Operator namespace RBAC + utilisation baselining | $44K | 30% | N11 | 520% |
| Caliptra attestation failure alarmed to the SOC | $26K | 25% | N11 | 480% |
| Authenticating inference gateway + ROCm runtime confinement | $56K | 30% | N11 | 410% |
| Split the shared L2 switch into electrical and cooling VLANs | $120K | 65% | N6 | 340% |
| Dual coolant path / thermal-buffer ride-through for DLC rows | $130K | 45% | N5 | 100% |
In the model, the cheapest control returns the most: an independent mechanical fuel gauge logged per shift costs $6K a year against the $295K N1 exposure and returns 2850%. Each control covers a single node, and seven of the fourteen treat N11, the accelerator estate, which carries $6.56M of the $11.93M baseline.
Every claim carries its provenance
The model records what is sourced, what is inferred and what is still unconfirmed. At the time of writing it held 20 recorded assumptions, 4 of high severity, with 7 gaps closed and 8 open. Cell independence was tested against the five requirements of the reference architecture rather than asserted.
| Cell requirement | Status | Evidence from the model |
|---|---|---|
| Independent MV/LV power train | MET | Each cell has 2 UPS in 2N, its own RPP and busway spine. Run in the explorer, a Cell A busway loss stops 77 assets and no Cell B rack; a single UPS loss stops 2 assets, the UPS and its battery string, and no compute rack, with the static transfer switch and the RPP held by their second feed. |
| Dedicated chiller / CDU cluster | MET | Six row CDUs scoped three per cell. Chillers and towers correctly held as shared central plant. |
| Independent BMS zone controller | MET | Per-cell zone controllers hold last-good setpoints if the campus BMS is lost. |
| Independent fire detection and suppression | MET | Per-cell addressable panels with their own detection and agent release, reporting one-way to the campus panel. |
| Dedicated OT network segment | MET | Per-cell OT switch, firewall and gateway; no inter-cell routing. |
A1 · Cell boundary · high · revised
96 racks at 120 kW is 11.52 MW IT, 1.4 to 2.8 times the stated 5 to 10 MW cell band, so per-cell consequence was overstated.
Resolved: the hall is two cells of 48 racks (6.91 MW each). Per-cell figures halved; campus cell count 14.5.
A3 · Node crosswalk · high · unconfirmed
Hazard-log node IDs were mapped to model assets by description: N2 to UPS, N5 to chillers and towers, N6 to CDUs, N8 to BMS, N10 to fire, N14 to rack BMCs. Every ALE attribution depends on this mapping.
Open: to be confirmed against the source documents.
About these figures
From model to compliance
A facility's obligations depend on where it is and what it does. The same accelerator rack faces different law in Rotterdam and in Riyadh, and different expectations from a regulator, an insurer and an acquirer. For this reference model the scope was set from five facts before any asset was drawn, and those facts decided which obligations the model had to evidence.
- 01
Location
The country sets the law: cybersecurity and critical infrastructure statutes, incident reporting deadlines, and the authorities the operator answers to.
- 02
Sector
Energy, water, transport and the other regulated sectors carry sector rules on top of national law.
- 03
Facility type
A substation, a port terminal and a datacenter have different control systems, safety cases and failure modes.
- 04
Supply chain and value chain
Who built and maintains the systems, where the components come from, and who depends on what the facility produces.
- 05
External pressures
Threat activity against the sector, geopolitical exposure, grid and climate stress, and disruption in the supply chain.
Obligations the model can evidence
Because every asset, connection and finding sits in one dataset, the same model serves several regimes at once. The table lists the main instruments that apply to a facility of this kind, with dates and requirements checked against official and authoritative sources as of October 2026, and how the model supports each. Links go to the official text or the regulator's summary. It describes what the model makes evidenceable; it is not legal advice on any specific obligation.
| Instrument | Jurisdiction | What it asks for | How the model supports it |
|---|---|---|---|
| IEC 62443 series | International standard | Zones, conduits and security levels: the owner's programme (2-1), service providers (2-4), risk assessment (3-2), system requirements (3-3), component requirements (4-2) | The zone and conduit design, SL-T per zone and the requirement each conduit carries are queries against the model |
| Cyber Resilience Act, Regulation (EU) 2024/2847 | European Union | Cybersecurity requirements for hardware and software products with digital elements. Entered into force 10 December 2024; Article 14 reporting of actively exploited vulnerabilities and severe incidents applies from 11 September 2026; the Regulation applies in full from 11 December 2027 | Product records carry firmware, SBOM and supplier provenance, so a component advisory can be traced to every place that component is installed |
| AI Act, Regulation (EU) 2024/1689 | European Union | AI intended as a safety component in the management and operation of critical digital infrastructure, or of water, gas, heating or electricity supply, is high-risk (Annex III point 2) and must achieve an appropriate level of accuracy and cybersecurity and be resilient to errors, faults and attempts to alter its use (Art. 15). Following the AI Omnibus, Annex III rules apply from 2 December 2027 | AI systems that write to facility controls are modelled as assets with their own pathways, so their write authority and blast radius can be shown rather than asserted |
| Machinery Regulation, (EU) 2023/1230 | European Union | Replaces the Machinery Directive 2006/42/EC and applies from 14 January 2027, adding requirements for software, connectivity and the protection of safety functions against corruption | Control-system pathways and protective functions (trips, interlocks, abort stations) are modelled separately from load, as a safety case needs |
| NIS2 Directive, (EU) 2022/2555 | European Union | Ten risk-management measures including supply chain security (Art. 21(2)(d)), and incident reporting with a 24-hour early warning, 72-hour notification and one-month final report (Art. 23). Data centre service providers are Annex I digital infrastructure | The risk portfolio, supplier pathways and Z6 external connections supply evidence for the risk-management measures and the supplier assessment |
| CER Directive, (EU) 2022/2557 | European Union | Resilience of critical entities against all hazards: Member States identify critical entities by 17 July 2026, and those entities assess risk and take resilience measures | Cascading failure across power, cooling and controls shows physical consequence and where resilience holds |
| Security of Critical Infrastructure Act 2018 | Australia | A register of critical infrastructure assets (Part 2), a board-endorsed risk management programme covering cyber, personnel, supply chain, physical and natural hazards (Part 2A), and mandatory cyber incident reporting (Part 2B) | The asset register and the risk layer give the inventory and hazard basis a risk management programme starts from |
Secure by design, not secured after
Built on verified data
What a model like this gives each team
| Team | What they get |
|---|---|
| Executives and risk owners | Consequence in money and hours, a ranked portfolio, and the return on each control, ready for the risk ledger |
| Procurement and acceptance | Each envelope component traced to its BOM line and the FAT that accepted it |
| Controls and operations | Their own equipment, protocols and interlocks, modelled closely enough to trust the conclusions |
| Network and security | Zones, conduits and pathways prioritised by what a compromise actually reaches |
| Safety and reliability | Cyber-initiated failure modes returned to the hazard log, with protective functions modelled separately from load |
Because every artifact is a view of one dataset, the asset register, ZCR diagram, threat pathways and executive figures cannot drift apart. When a firewall rule changes or a rack generation is replaced, the queries are re-run and every artifact moves with the plant.
The bigger picture
This facility is one application of the Cyber Digital Twin. The same structure (data model, routing, zone and conduit rules, protective layer, risk layer and integrity gates) applies to any facility with design documents and an interface list: substations, water treatment, pharmaceutical production, transport; virtually any infrastructure or product can be modelled. The documents change; the method and the trust in the numbers and process do not.
From reference model to your facility
In many situations, such as M&A due diligence or digital transformation, design and as-is documents are hard for an organisation to provide. The Cyber Digital Twin carries reference models, this one among them, to start an initial model. In a real engagement that model is then refined with the facility's own teams, through interviews, supplier materials, telemetry and other information, to raise its fidelity and precision. In many cases the Cyber Digital Twin becomes the single source of truth an organisation is looking for.
Explore the Helios model
The explorer described on this page is published and opens in any modern browser: select any component, filter by service, protocol or zone, and run a threat walk or a cascading failure.
Working with Eigenia
This reference model was produced with the Eigenia Cyber Digital Twin method. The same model underpins each of the services below, so work started for one purpose carries into the next instead of starting again.
Transactions
Acquisition Facility Diligence
What is really running, before you sign.
New build
New construction
Security specified with the design, not added after commissioning.
Brownfield
Refits and upgrades
Upgrading a running plant without stopping it, and without leaving it exposed while the work is under way.
Compliance
IEC 62443 engineering compliance, full integration
The whole series applied as one programme, from the asset owner's policies to the components on the floor.
Technical authority
Lead engineer
One accountable engineer on the owner's side, across designers, integrators and contractors.
Continuous
Continuous digital twin assessment
A cyber-physical model of the facility, kept current with its own telemetry and with the law that applies to it.
Product
CRA conformance
For manufacturers of industrial and OT products sold into the EU: the most likely route to conformity with the Cyber Resilience Act, and the work to get there.
Explore the live model above, or contact info@eigenia.nl to discuss a model of your own facility.
Enquire about this serviceNo warranty
This page and the model it describes are provided for illustration and education only, without warranty of any kind, and make no declaration that any figure, interface, configuration or finding is correct or complete for any real facility. Product names are used to describe publicly documented equipment classes and do not imply endorsement by, or affiliation with, their manufacturers. Regulatory summaries are not legal advice.
Eigenia is not affiliated with, sponsored by or endorsed by AMD.
AMD, AMD Instinct, EPYC, Pensando and Helios are trademarks of Advanced Micro Devices, Inc. Dell, Arista and Broadcom names are trademarks of their respective owners.
Eigenia Labs · Open-source research model · figures derived from the published model datasets, 2026-10-06
This Site Uses No Cookies
Eigenia does not set cookies. The only thing stored in your browser is one preference, saved in local storage, noting that you have seen this notice.